
Measures Based on SM and Web Activities
Learning Objectives
1. Be aware and learn measures available to analyze social media activities.
2. Understand web activity metrics and monitoring.
3. Understand tactics to use web activity measures for specific SM posts or campaigns.
4. Understand social media “monitoring” and monitoring measures.
5. Qualitative analysis: understand SM “listening” & tools to analyze SM information.
6. Understand difficulty arriving at a return-on-investment for social media activities.
7. Know the approaches to an ROI calculation.
A starting point to the measures and metrics for social media is an overview of an organization’s and community’s activities on social media and website.
Activity on Social Media Sites
It is fairly straightforward to track activity within the social media marketing platforms and it is becoming easier as the social media sites improve their tracking summaries. Figure 5.1 is a screen shot of a current activity report for a Facebook page for my social media class. (Activity is a little low because the screen shot is during summer break.) Looking at the far right of the graph (June 5), posts have reached 136 people in the past seven days and five people talked about the site. There have been only two posts in the past 28 days as shown in the table. The table shows engagement on the posts for lower of the past 28 days or since the post: 71 unique people (“reach”) have viewed the post about author Kathryn Jordan (Voices), six of them “engaged” by clicking on the link (to Amazon), six viewers are “talking about this”—which means Likes, Comments, or Shares of the post. The “virality” measure, 8.45 percent, is the ratio of “talking about this” to “reach.” As you can see, quite a bit of activity data is available on this one page.
Figure 5.1. Facebook Statistics for Social Media Marketing class page (2012)

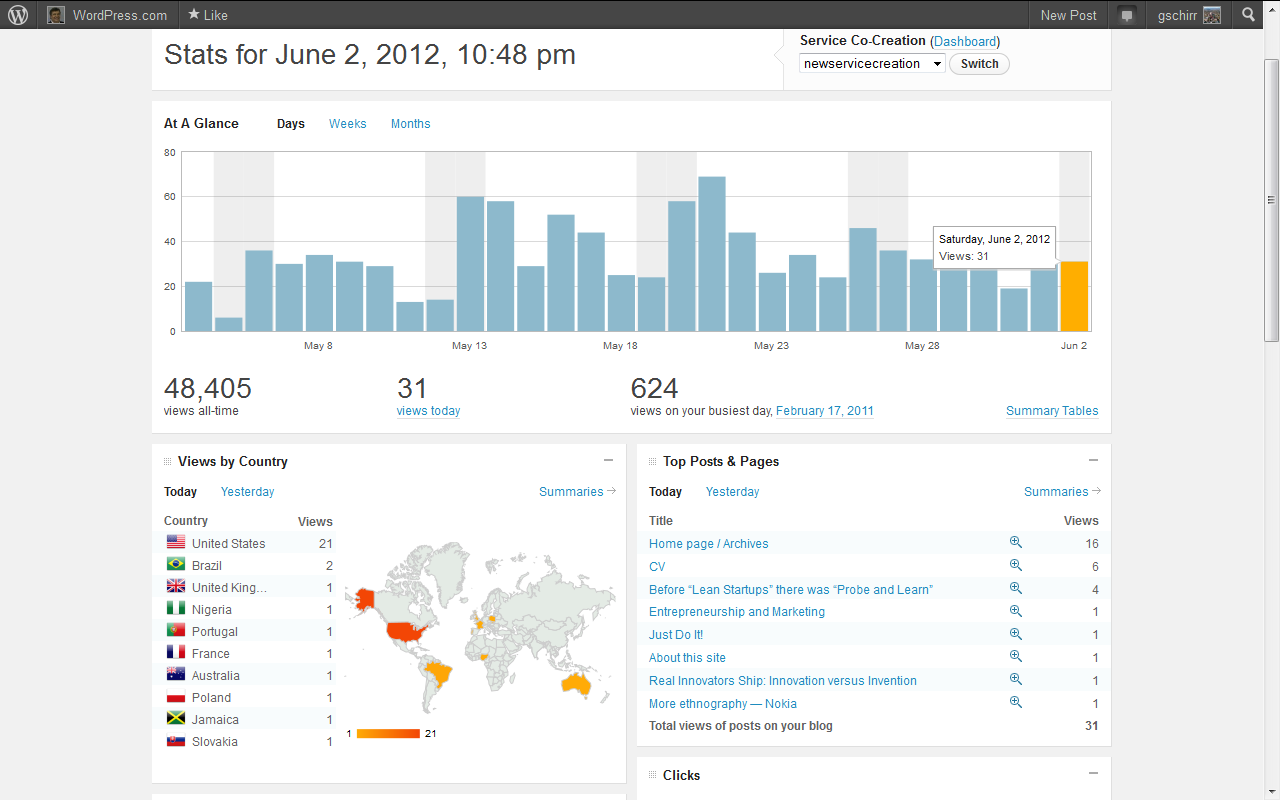
Blog sites, such as WordPress, are also providing their own measures and data summary pages. Figure 5.2 is a screen shot of the standard report on the WordPress site for hosted blogs. Note that much of the data is presented in a clear format or dashboard, allowing a blog author or manager to quickly assess trends. The graph shows daily visits and the depiction gives a sense of the trend. Country of the visitors is displayed on a globe and table; additional tables show which posts are being visited, what sites visitors are coming from, what key words led to visits from search sites, and which links were clicked by visitors.
Figure 5.2. WordPress Statistics Page for Service Co-Creation (Author’s blogs)
All of the data provided in Figure 5.2, plus more are available for all web sites, is through Google Analytics, a free service. Google Analytics can be installed on most blog sites, including hosted sites such as http://www.wordpress.com. I recommend that organizations use Google Analytics for the richness and customization possibilities.
Google Analytics will track data on any URL or web page on which someone has added a code supplied by Google Analytics that enables it to track activities. Each page of a website can be tracked, as can a standalone blog or even a Facebook page that has a URL. Even a privately hosted blog may allow the Google Analytics code to be added to every page to facilitate analysis. A brief summary of the data and tools available follows: as always you’re encouraged to go online and explore the metrics to obtain a hands-on feel for what is being measured and the data available.
Google Analytics
Google Analytics is a flexible tool that allows an organization to configure screens or reports to be useful to its needs. A thorough discussion of Google Analytics is mandatory in a course in Internet or Digital Marketing. However, an understanding of Google Analytics tools is certainly useful for social media marketing as well, since there are many applications such as blog sites or social media activity to enhance the organization’s website traffic and these analytics can help measure outcomes.
There are three primary components of Google Analytics: acquisition of site visitors; engagement of visitors; and outcomes of site visits. Metrics within those three components are summarized in the following discussion.
Acquisition of site visitors: Google measures visits to the designated website. One metric of interest is of course the number of visits to a site but a great deal of other useful information on visitors allows for further understanding of the web traffic. Measures about visitors from Google Analytics include:
• Number of visits
• Country of origin and language of visitors
• Where website visitors came from—another website, search engine, social media site
• For visitors originating from a search site, the topic that was searched
• Repeat visitors
• Computer, browser and mobile device used
• First-time visitors
Beyond the “headline” number of how many visitors come per day, there is a lot of information on your visitors’ activities here! Some of the information might best be tracked as ratios such as percentage of first-time visitors, percentage of visitors from specific search engines, percentage using mobile devices, and percentage of foreign or non-English speakers. Such metrics would of course be of keen interest to a firm running campaigns to improve its search engine optimization (“SEO”), the attractiveness of the firm’s online efforts on mobile devices, or multinational efforts.
Engagement of your visitors: What do visitors do once they arrive on the site? Metrics tracked in Google Analytics include:
• Pages per visit
• Average time on the website
• Number of single-page visitors
Engaged visitors should spend more time on the site and visit more pages. A high number of single-page visitors or bounces may indicate that your initial or launch page is not “sticky” and needs additional content or be redesigned to be more appealing.
Outcomes of site visits: What was accomplished by a visit? Google Analytics allows an organization to focus on custom measures of engagement. For example:
• URL destination: Is there a key page of your site that you wish visitors to view?
• Time on site or pages per visit: Track customers who spend at least a set amount of time or view a specified number of pages.
• Events: Track specific actions visitors are taking on a page. This includes anything from downloading a PDF to watching a video, to clicking a specific link.
Experimentation Using Web Analytics
It is useful for an SMM team to know the number of visitors to a website who came from social media sites and to know their activities on the company website. To use analytics to understand the power of a particular promotion or message, or to track the behaviors of web visitors originating from a social media site, an organization can customize a link and focus on it, or customize an alternative landing page on the webpage for selected visitors.
Custom URLs
Figure 5.3. Examples of Statistics from a Shortened URL in a Single Tweet

URL shorteners, provided by multiple services including bit.ly, goo.gl, ow.ly, and tinyURL, can be a fast and powerful way to track action on a link. One benefit of these services is reduce the characters in a long URL that looks unwieldy in the text of a post or blog, or takes up too many of the allocated 140 characters in Twitter. URL shorteners also facilitate tracking from a particular link. For example with Google’s shortener, goo.gl, a user simply enters the long URL and then copies the short version to include in messages; the shortener will allow small URLs of the same link.
Figure 5.3 shows statistics from a single tweet with a goo.gl link in a late morning. The site automatically generates a quick response bar code (“QR code”) for the custom link as well. As is typical for Tweets of an active tweeter, the link clicks were within an hour of the Tweet (there was another click eighteen hours later). Clicks originate primarily from the U.S.; there was one Spanish participant and one from the U.K. Two of the users used mobile devices. This is useful information for a social organization. It would be interesting to compare results from a different time of day, with a slightly different message, etc. to see the impact on these statistics. When using short links for market testing, an organization should be aware of the clear statement Google posts on the goo.gl site: “All goo.gl URLs and click analytics are public and can be accessed by anyone.” (If an organization is sensitive about competitors monitoring certain activities they may wish to explore alternatives to goo.gl for tracking those activities.)
Custom Landing Pages
Just as an organization can drill down on specific link behavior by creating unique links using URL shorteners, an organization can focus on specific web behavior by creating unique web landing pages. Micro sites or alternative sites allow in-depth tracking on the site. Thus, the power of Google Analytics can be enhanced by planning for activities to be measured or even running marketing tests and experiments. For testing websites, visitors can randomly be assigned to one of the alternative sites; for social media tests a different URL can be used to go to a tracked site. The onsite buying behavior of visitors that originated in social media or from a specific social media site can be tracked. What pages, links, how much time on site, and buying percentage can thus be tracked for visitors originated in social media or from a specific campaign. The full effect of social media will never be captured: how many Google searches are influenced by social media word of mouth? But difficulty in measurement should not stop a good SMM manager from continually monitoring and improving goals and measures of SMM performance.
Google Analytics Social Reporting
In combination with the Google+ social network, Google Analytics is creating some standard social tools to make focusing on traffic from social sites more straightforward. Key features already incorporated in the tool set include:
• Social visitors flow: What social sites web traffic on an organization’s website is coming from and what visitors from those sites do once they are on the website. Using this data an organization can compare visitors from FB, Twitter, Ad-words, etc. by:
1. Quantity from each site
2. Time on website for visitors from each social media site
3. Pages visited
4. Drop-off rate by page
5. Progress through conversion (sale)
A multi-channel funnel report can even trace customers through conversation for up to a month, showing all social media interaction.
• Social Partners: With multiple social media sites, including Google+, Digg, Blogger, Reddit, and many more—but unfortunately not Facebook, Twitter or LinkedIn—Google Analytics Social Reporting shows engagement summaries. An organization can monitor who has interacted with its content and monitor it real-time so it can respond in a timely manner across all these platforms.
The development of Google Analytics Social Reporting should be monitored by an organization’s SM team: as the organization uses more social media platforms and as Google reporting tools develop further, this tool set has the potential to aid the social media effort.
Summary of Data and Metrics on Social Media Activity
There is clearly considerable data for an organization to analyze from its own and its community’s activities on social media and web sites related to the social media. Summary lists may be useful to assess the discussion thus far. Table 5.1 is a summary of measure of organizational activity. These will generally be associated with a time period: an organization may track its number of Facebook posts a week, Tweets per day, or new video content on YouTube per month.
Table 5.1. Measures of Organizational Activity in Social Media
|
Type of Activity |
Sites: FB, Twitter, LI, YouTube |
On Blogs or other Web sites |
| Messaging | Tweets, posts | Publicize posts on other SM |
| Community building | Follows, Links, Likes | Read-comment on other sites |
| Content creation/distribution | Video, significant post or tweet | New blog post, white paper |
| Engagement | Reply to comments, Like posts | Reply to comments |
| Deeper engagement | RTs, likes of community posts | Comments on others’ blogs |
| Organizational involvement | Posts by non-SM-team members | Content outside SM team |
| Responsiveness | Time reply to others’ comments | Time to respond to comments |
As discussed in Chapter 1, there are rules of thumb for minimum daily or weekly messages on Twitter, Facebook, and LinkedIn, as well as for content posting on blogs, websites, or YouTube. Most of these activity measures will be relevant by comparison with past data or activity in other organizations. For example how does the organization’s SM activity compare to the activity of competitors or leading social organizations.
Table 5.1 includes measures of an organization’s responsiveness or engagement, such as liking other participants or their posts or speed in responding to other participants’ comments. Since social media is all about engagement it is important to assess the engagement activity of an organization’s social media community. Table 5.2 summarizes measures of community activity and engagement. Again, the activities of Table 5.2 are often measured by a time period such as new friends or followers per week. However it may make sense to track community activity to the organization’s activity, so many organizations track the number of comments per blog post, or Re-Tweets or Likes per Tweet or FB post.
Table 5.2. Measures of Community Activities or Engaging Customers
|
Type of Activity |
Sites: FB, Twitter, LI, YouTube |
On Blogs or other Websites |
| Joining the community | Likes, friends, links, followers | Subscriptions |
| Interacting | Re-Tweets, Likes of posts | Comments on posts |
| Curating | Daily summaries | Cite in other blogs |
| Community “Buzz” | Mentions of organization | Mentions of organization |
Curating and curation are often discussed in social media. A community member curates the content of the organization by recommending the content or by adding something to it and distributing the new combined content. Simply re-tweeting an organization’s Tweet or Liking a FB page post is therefore a weak form of curating as the community member has indicated their approval of the content. Stronger curation is when some of the organization’s content is embedded and cited in a new post by a community or included in a daily or weekly summary or newsletter put out by a community member.
Buzz is a measure of how many times an organization or its products or services are mentioned within a given time frame. Buzz is an important metric since word of mouth is a key component of social media marketing.
Key Takeaways
• Through Google Analytics and information provided by social media networks, there is a great deal of information measuring social media efforts available.
• By using alternative URL and web launch sites, the power of Google Analytics can be leveraged for controlled experiments.
• Measures of customer engagement include activities such re-tweets and Likes as well as curating and overall online buzz.
This is part #2 of an excerpt about “Metrics” from an early draft of a text for teaching Social Media Marketing. Please do not copy without the approval of Flatworld Knowledge and Gary Schirr. I welcome thoughts on omissions, additions and corrections!!!
Other articles:
Teaching SMM: METRICS #1 Importance of Measurement
Teaching SMM – METRICS #3 Measuring Influence: Art or Science?
Teaching SMM – METRICS #4 Influence Scores
Teaching SMM – METRICS #5 Monitoring and Listening

i must say thats some helpful stuff. i thought for a second that this was jetpack statistics but mine doesn’t show all that info. locations…